


A brief history of modern US inflation; The “real” unemployment rate; US wealth inequality increased since the late 90’s
Your dose of nonsense - Monday, 2021-03-08

If you liked this, consider liking, subscribing and forwarding. You know, for the algos. If you didn’t like it, consider forwarding it to someone you don’t like.

Source: u/NovelTAcct via Reddit
A brief history of modern US inflation
Or at least, what I can read up briefly on a Sunday afternoon.
Over the past couple of weeks, more people are very worried about inflation. It’s not to say that there aren’t any before this, it’s just that this train of thought is really playing out in real life over the past few weeks..
Here are some manifestations of this worry:
Many people are selling their bonds (possible rationale: If you hold a bond that pays you 5% per year and the inflation rate is 1% per year, you are effectively making 4% per year. If the inflation rate is up to 5%, you are effectively losing 1% per year. So why would you keep holding the bond? Everyone else would sell the bond until the bond’s price is cheap enough such that the returns can beat inflation again).
Many people are selling stocks in companies that are highly valued. (possible rationale: again, like with the bonds, inflation will erode the returns of the shares. Therefore people who can’t accept that erosion would sell the stocks. The price of the stock would drop until it is cheap enough such that the returns can beat the inflation. Another possible rationale is that high inflation causes costs to go up, harming profitability).
Prices of lumber, copper, steel, oil and other raw materials’ contracts have skyrocketed.
Is this good or bad?
First of all, is inflation good? In its abstract general form, some inflation is the least bad. And here’s why:
Let’s assume that our personal goal in life is to maximise the amount of overall happiness we experience. Now let’s say that getting a scoop of triple chocolate ice cream would make you the happiest person in the world.
First, let’s assume that the world you live in has the opposite of inflation, i.e. today, $5 will buy you 1 scoop; but tomorrow, the same $5 you have can buy you 2 scoops. And for you, 2 scoops is twice as good as 1 scoop. So you might strongly consider delaying your purchase. But on the ice cream vendor’s side, she’s going to lose money selling ice cream over the long run. She now practically has no incentive to set up shop and sell any ice cream, so she stops selling. This ultimately makes you unhappy because you now can’t get any ice cream. Therefore, the opposite of inflation is bad.
Now in the case where there is zero inflation - i.e. today, $5 will buy you 1 scoop; tomorrow, the same $5 you have can also buy you 1 scoops. In short, you can choose to delay your need for ice cream. This is not that bad for the ice cream vendor’s business, but it’s not great either. The end result may be that there would be fewer ice cream sellers around in the long run, which may not be great when it comes to overall confectionary innovation.
Now in the world with modest levels of inflation - i.e. today, $5 will buy you 1 scoop; tomorrow, the same $5 buys you ¾ th of a scoop. In this world, you are very much incentivised to spend your money today! And from the seller’s side, it’s great because they are getting more business today. In this world, she can stay in business profitably, while you can also enjoy your ice cream - it’s sort of a begrudging compromise that we have from a consumer point of view.
But of course, in a world with runaway inflation, you’d probably just give up on getting any ice cream because it’s no longer worth it. That’s bad for the seller’s business too.
So how do we get inflation right?
Broadly speaking on a theoretical level, inflation is a function of supply versus demand - if there are 100 customers for ice cream, but there is only enough for 50, the customers are going to start offering more money so that they can secure their own scoop. Conversely, if there are only 10 customers, and there’s enough for 1,000 people, the seller is going to have a hard time breaking even, let alone making a profit.
Therefore, to get inflation right, supply and demand should more or less be in some kind of balance.
Of course, there is another layer to this - the supply of money. Going back to the 100 customers and 50 available servings example, if everyone collectively only had $250, the final selling price where the transaction would take place would probably be $5 a scoop. But if everyone had $500 instead, the transaction price would probably be $10 a scoop, simply because there’s more money to bid the price up. The output in terms of actual products sold (50 servings) is the same in both cases, but the price level is completely changed with different supplies of money. And in today’s world, it’s the governments who control the amount of money in the system.
Therefore, the inflation that we personally experience everyday is a function of demand, supply and the amount of money that is available.
Okay, this sounds all logical in theory. Can we have real examples?
Below is a chart I made by compiling US data for:
Consumer Price Index (Urban) - this is our measure of inflation (solid yellow line);
Personal saving rate - if you’re saving, you probably ain’t spending today (solid red line). Its relationship with inflation could be complex outside of theory-land / in the real world. This is because real people can behave differently to inflation. One might respond to inflation by saving up more (e.g. I really want an ice cream tomorrow, so I’ll save up more today to buy what I want tomorrow), while others might choose to spend today;
Money supply (M2SL) - for the purposes of this writeup, this is our measure of how much money (the US dollar) there is in the world (blue line);
Gross Domestic Product - as a measure of economic growth (green dots);
Labour force participation - I don’t quite like the definition of “unemployment rate” because the official definition excludes people who have given up trying to find work, but are otherwise able and also willing to work. Hence I use the labour force participation, which includes these people too (orange dots). I just find it weird when newspapers put up a headline that says “unemployment rate at record low”, but you know that reality makes it feel like the claim feels unreal until you know what the actual definition of the metric is. In the graph below you’ll see that after the Great Financial Crisis, the labour force participation rate has actually been decimated permanently.
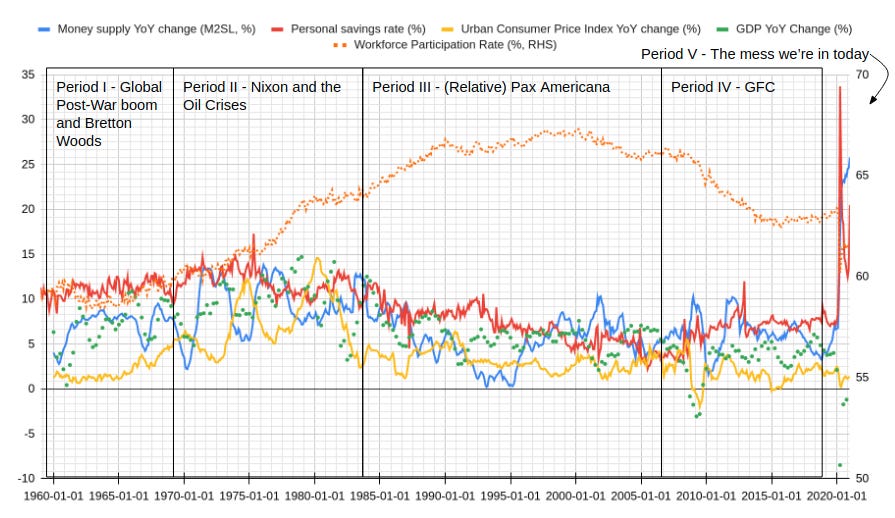
Source: Individual data series from US Federal Reserve Bank of St Louis, compiled and annotated by me.
Anyway, for this narrative, I’ve separated this chart into 5 periods:
Period I (1940’s to late 70’s) - Global Post-War boom and Bretton Woods;
Period II (Late 70’s to mid 80’s) - Nixon and the Oil Crises;
Period III (Mid 80’s to 2007) - (Relative) Pax Americana;
Period IV - The Great Financial Crisis; and
Period V - The mess we’re in today
Why am I going through history? Well, it’s to put our current inflationary fears into context, i.e. I’m going to use history to explain why we are so damn scared about inflation. Inflation may not happen to us within the next year or maybe even the next decade. Nobody knows. But we are sure as hell scared of it. And here’s why.
So what happened in each period?
Period I (1940’s to late 70’s) - Global Post-War boom and Bretton Woods
Post-War money spending:
So after the Second World War, the once major economies of Europe and Japan were decimated.
A non-functioning economy was one of the major catalysts that caused that war to break out. It would be great if the economies could be rebuilt so that another war is less likely to occur.
Oh, also, the US didn’t like the potential spread of communism. The US would need to chip in to tell the world that capitalism is great, and please Buy American.
So the US, via the likes of the Marshall Plan, financed the reconstruction. US Dollars flooded the world.
At this point, 44 countries came together to a hotel in Bretton Woods and agreed that the US Dollar would be the only currency that can be used to buy gold. Everyone else’s currencies would be roughly pegged to the Dollar, cos you know, America had most of the world’s gold at that point, and America was not decimated in the war, unlike everyone else.
US domestic spending also increased:
It was around this point that Medicaid and Medicare were set up.
There was also the “War on Poverty” programme going on.
Wars are expensive. The US was paying for the last one, and now also a new one in Vietnam.
All these needed money, so the US started printing Dollars faster than it could get more gold. Because of this twin issues of:
Extremely high government spending (creating extra demand); and
Extremely high money printing relative to gold reserves (blue line)
Inflation really, really picked up at the end of this period (yellow line).
This is the moment that we learnt that too much spending and too much printing = bad.
Period II (Late 70’s to mid 80’s) - Nixon and the Oil Crises
By 1971, the gold peg was untenable. Countries were worried so much that the Dollar was so overvalued that they all demanded their share of gold from the US by exchanging their dollars for gold. The US gold reserves were decimated. This was the international equivalent of a bank run.
To stop this gold outflow, Richard Nixon nixed the gold standard. The US dollar is now a free floating currency. This was meant to be a temporary measure. Was.
In his televised address, Nixon said
In the past 7 years, there has been an average of one international monetary crisis every year ...
I have directed Secretary Connally to suspend temporarily the convertibility of the dollar into gold or other reserve assets, except in amounts and conditions determined to be in the interest of monetary stability and in the best interests of the United States.
But just as the US thought that it could come to grasp with inflation, there was a supply shock on the horizon. Unfortunately for the US and its allies, countries in the Middle East weren’t happy with some of the US’s foreign policies, and decided to cut its oil supply, twice.
Energy prices skyrocketed. The demand for energy was still there, but there’s just not enough to go about. In short, another inflationary pressure popped up, causing inflation to spike (yellow line, twice because of the two embargoes).
The US tried to tame the resulting inflation by tightening money supply (see that the blue line falls when the yellow inflation line goes up). However, while this may solve the original pre-embargo inflationary pressure, this surely didn’t fix the second problem - there simply wasn’t enough oil to go about!
This money tightening and resulting interest rate increases caused many US banks to fail in what is known as the Savings and Loans Crisis. Oh and, there was a major recession as well. So not great! The US had two competing sources of inflation. The US tried fixing one, but the supply shock won out.
It’s at this time that we learnt that supply shocks = bad.
But good news in the period is that female labour participation has increased during this period! (Orange dotted line).
Period III - (Relative) Pax Americana
Just coming out of a recession. Everything’s looking great so far.
More women in the workforce. Households don’t have to save as much.
As workforce participation plateaus, economic growth stabilises but is still pretty good.
Leveraged buyout and high-yield bond booms in the 80’s (they wouldn’t grow without each other!)
We (mostly) love the 90’s.
Sure, pets.com was probably all hype, but amazon.com, Google, and Apple after Steve Job’s return turned out to be great!
Period IV - Global Financial Crisis
Crap. We had a great thing going, but we blew it up.
There’s just so little economic demand relative to the previous period.
Official workforce participation drops.
But savings rates are low.
Crap this is very bad. Someone needs to jump start the economy.
The government pumps gajillion dollars into the economy. Inflation is still stubbornly low. Like attempting to push something with a rope.
Someone claims that he’s going to make America Great Again? Sure, if I have nothing to lose, why not?
Remember that we learnt in Period I that big government spending and money printing led to bad inflation? This is where we unlearnt that.
Period V - The mess we’re in today
So here we are. We have learnt from history that:
Big government spending and money printing is sometimes bad, and sometimes does absolutely nothing.
Supply shock = bad.
So here are our current circumstances:
Demand is set to pick up - as people come out of lockdowns, people start to buy goods and services again.
Personal saving rates have also been up. People can choose to spend it now if they want to.
Uncle Sam is going to also pump $1.9 trillion into the economy.
But uhoh! No one has built up inventory during the pandemic! If you didn’t know a few months ago that things are going to get better, why would you waste money on stocking up?
So now that everyone is ordering stock at the same time, there is a supply issue! E.g. there is a global chip shortage; shipping rates are up as shipping companies themselves have yet to ramp up; and factories also have yet to ramp up as well!
Is this large impending demand increase going to cause inflation to go through the roof like in Period I? And is this supply problem going to compound the problem further like in Period II?
Or is absolutely nothing going to happen, like in Period IV?
Place your bets!
The “real” unemployment rate
So one issue in life is that, when you make a decision, you have to draw the line somewhere. As for the unemployment rate, the official definition (the “U-3” definition) does not include people who are able and are willing to work, but have given up. It also does not include underutilised talents, excluding people who take up part time jobs and/or gigs to support themselves for the time being.
That’s why I quite like the U-6 definition that does include them. Naturally, this measure (red line( is a lot higher than the official U-3 rate (blue line):

Source: US Bureau of Labor Statistics
If I took the difference between these two lines, I would get the proportion of people who are discouraged job applicants and part-time workers. You can see here that after the Financial Crisis, this share has grown a lot, only getting back to pre-Financial crisis levels at the end of 2019:

Source: I created this diff based on raw data from the US Bureau of Labor Statistics
Well, that is until the pandemic hit.
US wealth inequality increased since the late 90’s

Source: US Federal Reserve
This is a decade before the Great Financial Crisis. I wonder why this is so.
It’s probably too convenient to point the finger at globalisation and to pin it on China joining the World Trade Organisation in 2001. I mean, globalisation was already a thing before that, such as the Japanese economic miracle and the rise of the Four Asian Tigers.
I guess this would be for another time.
PS: None of my content is sponsored content. All opinions are my own. Nothing in this newsletter is investment, legal, business, medical, or life advice (my subtitle is “Your daily dose of nonsense”). Don’t be believing everything a random guy on the internet says.